Map Charts
Choropleth
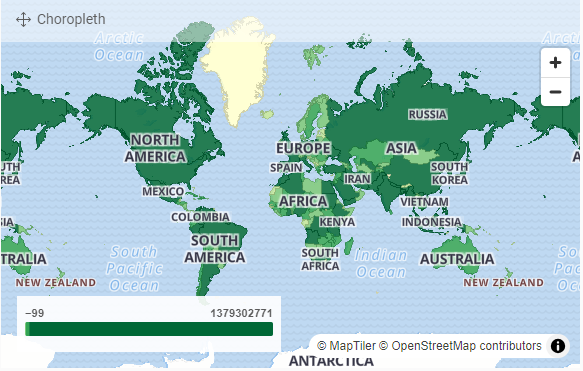
With the choropleth map, the country is colored depending on a value (number of contacts, average open %, value per contact,…)
Characteristics:
- Nice visual to express
- Zoom-options, especially when created based on specific locations (users, stores, …)
- Can be used as a filter
Symbol
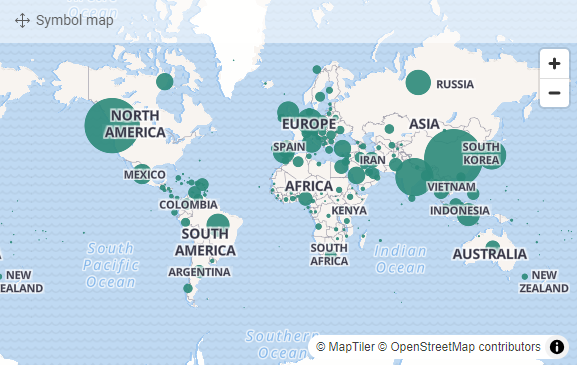
A symbol map shows measures in specific places. These could be center points of large regions or specific locations determined by a topography-column
Characteristics:
- Zoom-options, especially when created based on specific locations (users, stores, …)
- Online usage to interpret the dots
- Cannot be used for filtering
Marker map
A marker map places an aggregated value on a map (count, sum,…)
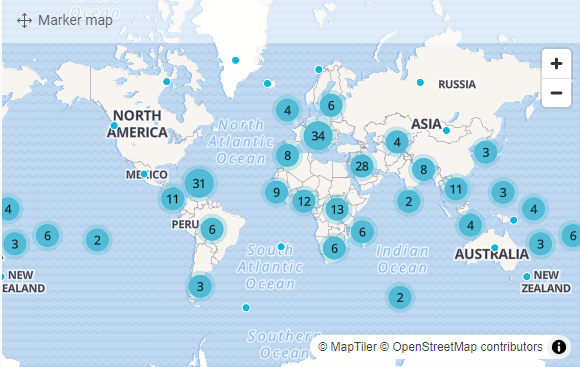
Characteristics:
- Zoom-options, especially when created based on specific locations (users, stores, …)
- No filtering
Hexbin map
A hexbin map splits up areas in hexbins and colors each hexbin accordingly
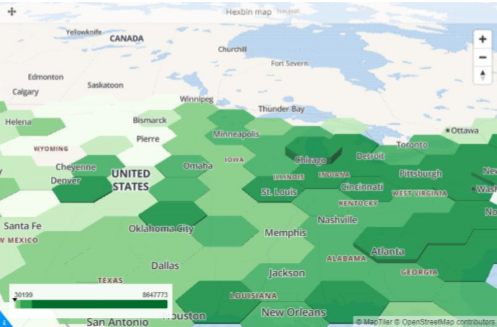
Characteristics:
- Zoom-options, especially when created based on specific locations (users, stores, …)
- No filtering
Heatmap
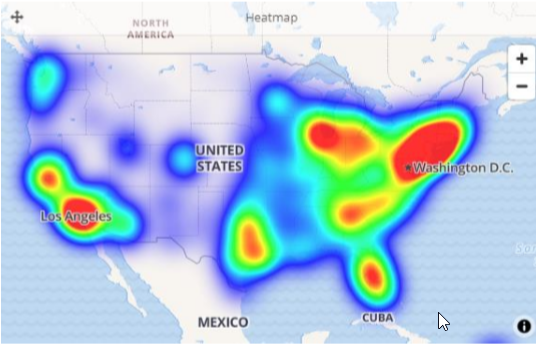
Characteristics:
- Colors the map according to the measure
- No filtering
